The winMulti software contains a system to monitor machine performance and a screen to view the details. It is accessed by tapping the service button, then selecting “Output Timings”.

Output Timings Tab
Every minute that the machine is powered on, it logs how many seconds it is either
• Machining
• Loading
• Waiting for the transfer table
Any seconds “left over” are classed as idle, ie the machine is doing nothing.
In practical terms this is because the machine is stopped for break time, stopped for an alarm, or waiting for the operator to fetch profile. It could simply be that there was not enough work to do, and the operator completed the work in the time allotted.
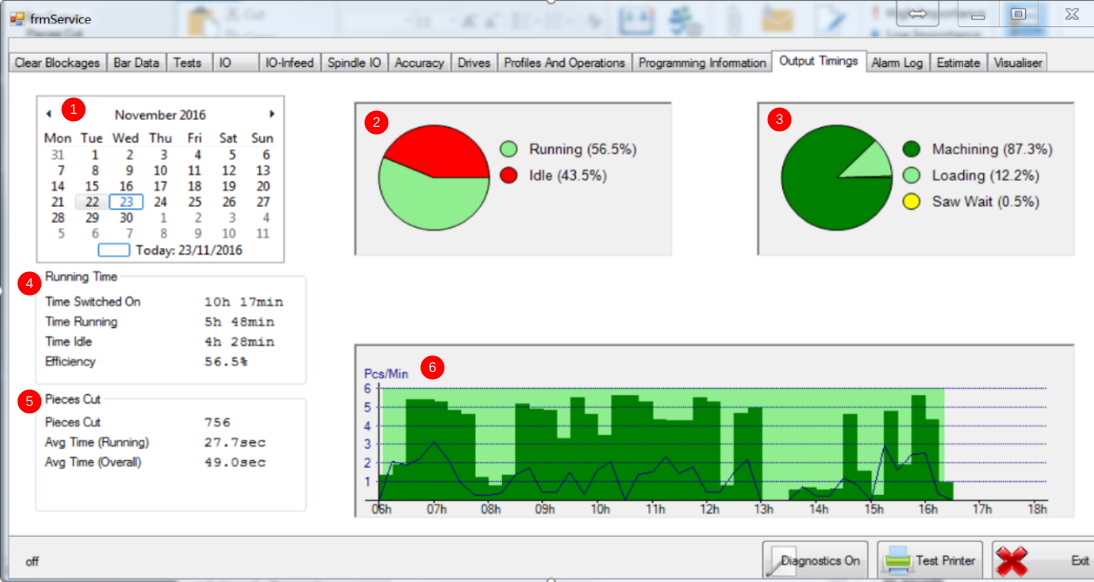
- Date is selected on the calendar, which updates the data
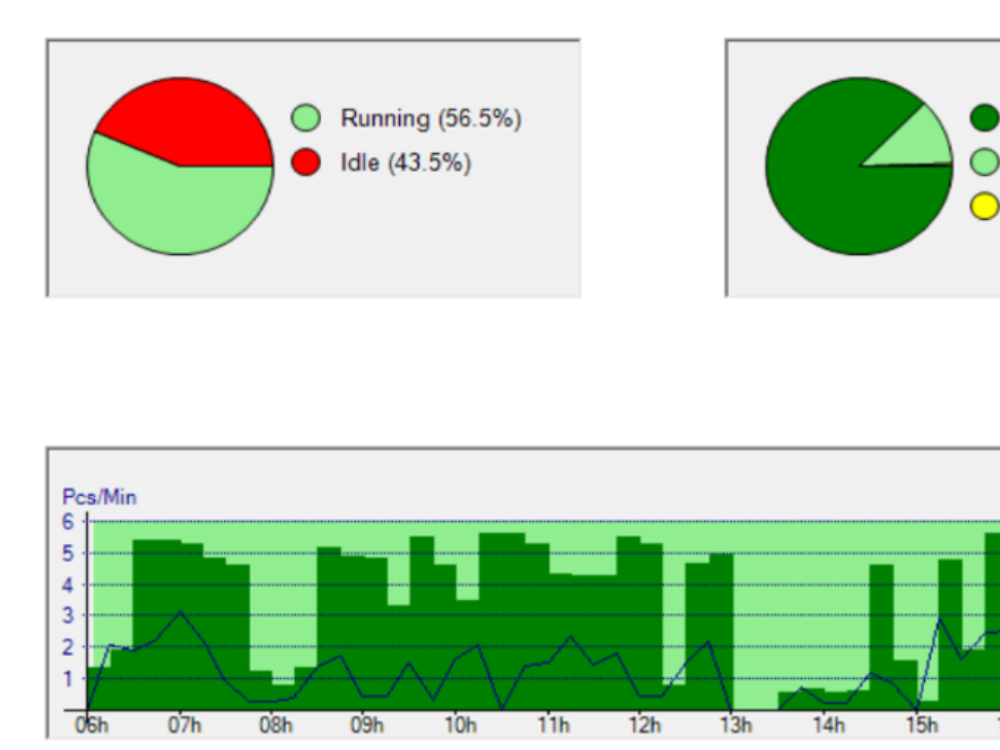
- Top Middle chart shows the overall efficiency – ideally the running % should be as high as possible
- Top Right chart shows how the running time is broken down into Machining, loading and Waiting for transfer table (or saw outfeed table full – if sensor is fitted). A more efficient operator will keep the loading time lower and have no saw wait time, because the machine is kept loaded and unloaded and running continuously
- Running Time data shows
- Time Switched On – hours that the machine was powered up and winMulti running
- Time Running – Total of all seconds that machine classed as running
- Time Idle – Time Switched on minus Time Running.
- Pieces Cut data shows
- Total pieces cut on date
- Avg Time (Running) – This shows how long each piece takes on average if the idle time is discounted. This is the achievable output rate if the machine was run at 100% efficiency
- Avg Time (Overall) – This shows how long each piece takes including all the idle time
- The Graph shows the efficiency over the course of a 6am to 6pm shift
- The graph is displayed in 15 minute chunks, the dark green shows the level of efficiency during that period
- All dark green = 100% efficiency
- All Light green shows completely idle
- Light green area stops and starts on machine off / on time
- The blue line displays the pieces output per minute at that time, scale on left hand side.
- The graph is displayed in 15 minute chunks, the dark green shows the level of efficiency during that period
Version 6 Software
Version 6 software has more features
| Data | Meaning | Notes |
|---|---|---|
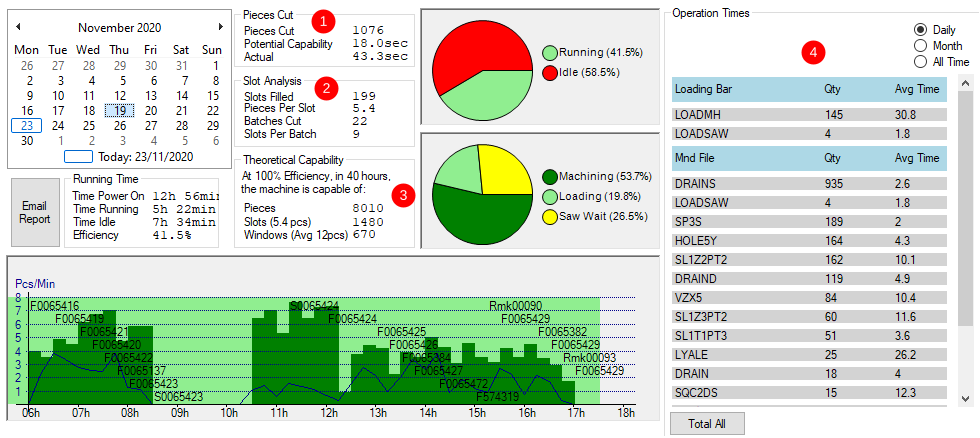
| Pieces Cut | How many pieces have been cut between 06:00 and 18:00 | |
| Potential Capability | The cycle time of each piece when the machine is "running" | "Running" means the infeed table is loading or the machining head is working |
| Actual | Number of seconds switched on divided by number of pieces cut |
| Data | Meaning | Notes |
|---|---|---|
| Slots Filled | How many slots have been filled between 06:00 and 18:00 | A slot is defined as the pieces that belong to slot on a particular batch.
If batches are separated into frame and sash batches, there will be a slot for the frame and another for the sashes Sometimes there is more than one slot for each window frame - it depends how the Window designing software is set up and how the information is batches |
| Pieces per Slot | Total number of pieces cut divided by Total number of slots filled | This demonstrates the complexity of a 'slot' |
| Batches Cut | How many batches have been completed | This only counts completed batches, so a batch that is not completed on one day will show up as completed when it is finished the next day |
| Slots per batch | Number of slots divided by number of batches | This shows the average batch size in windows. This should be kept to a high figure (>=20) for maximum efficiency. Small batches are less efficient in both optimisation of profile and time taken to process offcuts |
| Data | Meaning | Notes |
|---|---|---|
| Pieces | This is how many pieces would have been cut in 40 hours, if the machine could be run at the most efficient it was on that day | This is simply an indication of how it could perform on the production mix it has been given on that day |
| Slots (n pieces) | Using the theoretical pieces, and how many pieces are in an average slot (n), this shows how many windows per week the machine would output, given 100% and given the production mix on that day | |
| Windows (Avg 12 pieces) | Given the best cycle time per piece, this is how many 12 piece windows could be created | This is purely theoretical and is based on the production mix on that day. If there were slower machining pieces (eg doors) on that day, it would be a lot slower than if simpler windows were run |
The operation times box shows a stuga engineer the frequency and prevalence of a particular operation. This helps identify where the greatest savings can be made for operation time optimisation
Factors Creating Inefficiency
- Keep the consumables rotated
- Saw blade sharpening regime
- Cutter change routine
- Stock labels always available
- Keep the machine fed –
- Ensure machine is kept fully loaded
- Use another operator to fetch and unwrap profile
- Move profile closer to machine
- Keep profiles organised and easy to load
- Keep offcuts organised and easy to find
- Use the “Next Batch” feature to overlap batches to ensure no delay from one batch to next
- Don’t let the transfer table fill up (flowline only)
- If the saw is paused, and transfer table full, whole machine will stop
- Keep running the saw all the time
- Ensure empty profile trolleys are readily available
- Man the machine during breaks
- Break times are obvious to see in the graph
- It is common that many minutes are also lost either side of a break period
- Use the remakes facility with care
- Running one or two quick remakes is very inefficient
- Batch like windows (colour and system) together to reduce offcut creation
- Creating offcuts is inefficient
- Using offcuts is inefficient
- Finding and fetching many different colours is inefficient
- Consider switching off the profile prompt
- Profile prompt is switched on by default, as it is useful for new operators
- It creates a delay every time the profile or colour is changed over
- Ensure machine is serviced regularly by Stuga Engineers
- Cycle time is very much dependent on cylinder speed settings
- Lubrication is very important
- Worn or faulty parts affect performance
See Also
For more information on how to set up automatic email of a production report and accessing the raw data from the machine:
Setting Up Email Production Reports
Draft
 Français
 English
 Deutsch
 Español
 Italiano
 Português